Intro
This project aims to analyze hospital discharge volumes, financial performance, illness severity impacts, and geographic trends to uncover patterns in patient care costs, hospital efficiency, and patient outcomes across New York State from 2009 to 2017, and 2021.
With over 1.19 million rows and 14 detailed columns, we evaluate key performance indicators across multiple dimensions to identify best practices and uncover the factors that contribute to hospital efficiency.
"Our objective is to uncover actionable insights into hospital performance across New York State"
The areas we focus on are:
1. Analyzing hospital discharge volume trends
2. Identifying hospitals with exceptional financial performance (both profitable and unprofitable)
3. Examining the relationship between illness severity and healthcare costs
4. Mapping geographic differences in patient care and financial metrics
5. Ranking hospitals based on custom metrics such as profitability and complexity handling
How to Evaluate Performance
Discharge Volume
to measure the rate of hospital activity
The total number of patients released from the hospital after treatment
Severity Level
to assess the complexity of patient conditions, as it affects the hospital's workload and resource usage.
Severity Weighted Score = (1 × Minor Discharges + 2 × Moderate Discharges + 3 × Major Discharges + 4 × Extreme Discharges) / Total Discharges
Profitability
to evaluate financial health
Profit = (Mean Charge - Mean Cost)
Profitability = Profit / Mean Charge
By using these three areas to assess performance, not only is physical performance evaluated (discharge and severity), but financial performance is also considered. We can then identify which hospital performs best in terms of efficiency.
1️⃣ Overall Hospital Activity & Volume Trends
Overall Dashboard

Overall Discharge Trend
If the dashboard is loading too long, feel free to open in here

Over the period from 2009 to 2021, there is a clear downward trend in hospital discharges, representing an approximate 22% overall decrease.
Several factors may have contributed to this decline:
1. A shift toward outpatient care models is reducing the need for inpatient admissions.
2. Advances in medical technology enable faster treatments and shorten hospital stays.
3. Policy changes that impacted admission criteria and healthcare delivery practices.
4. The COVID-19 pandemic after 2020 led to widespread postponement of non-urgent procedures.
While Mean Charge remains a key financial metric, the decreasing volume of discharges could have significant implications for hospital revenue models and operational planning, especially if fixed costs remain high while patient throughput declines.
Where is discharge density located?

The geographic distribution of hospital discharges and profitability across New York State reveals notable patterns.
The larger circle sizes indicate that hospitals in the New York City metropolitan area exhibit the highest discharge volumes. However, higher discharge volume does not necessarily correlate with higher profitability. Despite handling large patient volumes, several NYC-area hospitals show low or even negative profitability, suggesting operational inefficiencies, high costs, or payer mix challenges.
In contrast, hospitals located upstate generally have lower discharge volumes and often maintain more favorable profitability ratios.
This pattern highlights the complexity of hospital financial performance, where patient volume alone does not guarantee financial sustainability, and underscores the need for tailored operational strategies depending on regional dynamics and patient demographics.
2️⃣ Evaluating Financial Health
Overall Charges and Costs Trend

Between 2009 and 2022, both the average hospital charges and average costs steadily increased across New York State. Avg. Charges grew at a significantly faster thean Avg. Costs, especially after 2015, creating a widening gap between billed charges and actual costs.
Total Profitability (measured as (Charges - Costs) / Charges) remained relatively stable from 2010 to 2016, fluctuating slightly but staying around the 50%–60% range. After 2016, despite the sharp rise in charges, profit margin did not increase dramatically, indicating consistent hospital financial performance even as healthcare pricing escalated
Who high Profits?
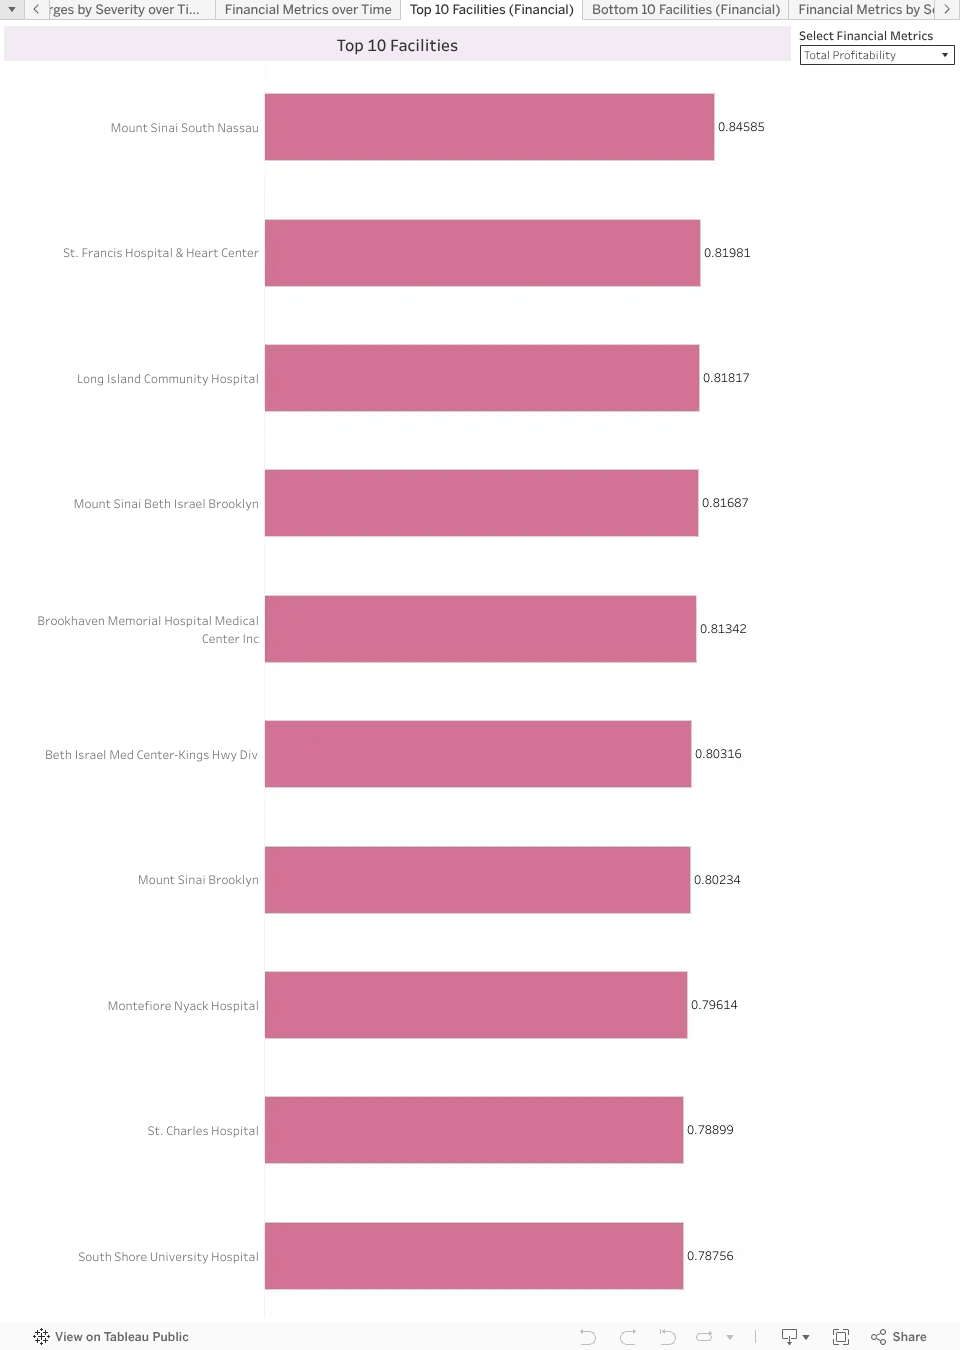
This chart ranks the top-performing hospitals by average profitability(%) over the same period. Hospitals are listed from highest to lowest average profitability.
Who face Losses?

This chart highlights hospitals with negative average profitability from 2009 to 2024. Hospitals are ranked by their average profitability(%), with facilities operating at the greatest financial losses shown at the top
3️⃣ Impact of Diagnosis Type and Severity of Illness
Does Severity impact the Discharge volume?

Moderate severity accounts for the largest number of discharges(9.1M), followed closely by Minor cases(8.5M). Extreme severity cases make up the smallest portion(1.6M)
Do Costs and Charges increase with Severity?

Severity level strongly impacts hospital costs and charges: Extreme severity cases have the highest mean costs and charges, followed by Major, Moderate, and Minor cases. The higher the severity, the greater the financial burden, reflecting the increased complexity and resource demands associated with more critical patients.
Trend of Charge, Cost and Profit with Severity over time

Over time, both costs and charges have steadily increased across all severity levels from 2009 to 2022. The financial gap between Extreme and lower severity cases has widened, reflecting higher resource demands for critically ill patients. Despite rising costs, profitability margins have remained stable across severity levels, consistently fluctuating between 60% and 65%. This indicates that hospitals adjust charges proportionally to maintain consistent profitability, even for more complex cases.
Who have the Highest Severity-Weighted* Discharge scores
If the dashboard is loading too long, feel free to open in here

The top 10 facilities by severity-weighted discharge score demonstrate strong clinical capability in managing higher-acuity patients, with scores ranging from 2.02 to 3.12, all above the systemwide average severity score of 1.99.These hospitals are likely treating more complex cases, often requiring more intensive resources and specialized care.
Financially, the system maintained a robust position, achieving a total profitability of 65.1% and a discharge-level profitability of 58.1%, despite the higher treatment complexity.
The average discharge charge was $53,603 against an average discharge cost of $19,393, highlighting strong operational efficiency even under a heavier clinical burden.
Overall, these top-performing hospitals successfully balance managing clinical severity and maintaining healthy financial margins, underscoring both their clinical excellence and operational resilience.
*To obtain a severity-weighted score, we multiply the discharge volume by the severity level and divide by the total number of discharges. This score helps us evaluate the relative severity of the cases handled by the hospital.
Who have the Lowest Severity-Weighted* Discharge scores

The bottom 10 facilities by severity-weighted discharge score manage lower-acuity patient populations, with scores ranging from 1.31 to 2.23, generally below or near the system average severity score of 1.99.
Treating less complex cases may simplify clinical operations, but can pose financial risks if reimbursement rates are lower due to reduced case severity.
Despite lower patient complexity, the overall system maintained a total profitability of 65.1% and 58.1% profitability per discharge, supported by an average charge of $53,603 and an average cost of $19,393 per discharge.
Sustaining profitability for these lower-severity facilities will depend heavily on volume efficiency, cost control, and optimizing payer mix, as they may have fewer opportunities for high-margin, complex care services.
*To obtain a severity-weighted score, we multiply the discharge volume by the severity level and divide by the total number of discharges. This score helps us evaluate the relative severity of the cases handled by the hospital.
Key Findings
1. Overall hospital discharge volumes have decreased slightly over time, especially for Medical, Minor and Moderate cases
2. Several hospitals exhibit unstable year-to-year discharge volumes
3. Higher severity of illness is strongly correlated with higher mean charges and mean costs. This could be due to the complexity of treatment or the use of specialized equipment for healing.
4. Profitability varies widely, with some hospitals consistently operating at a financial loss, and some of these have now permanently closed.
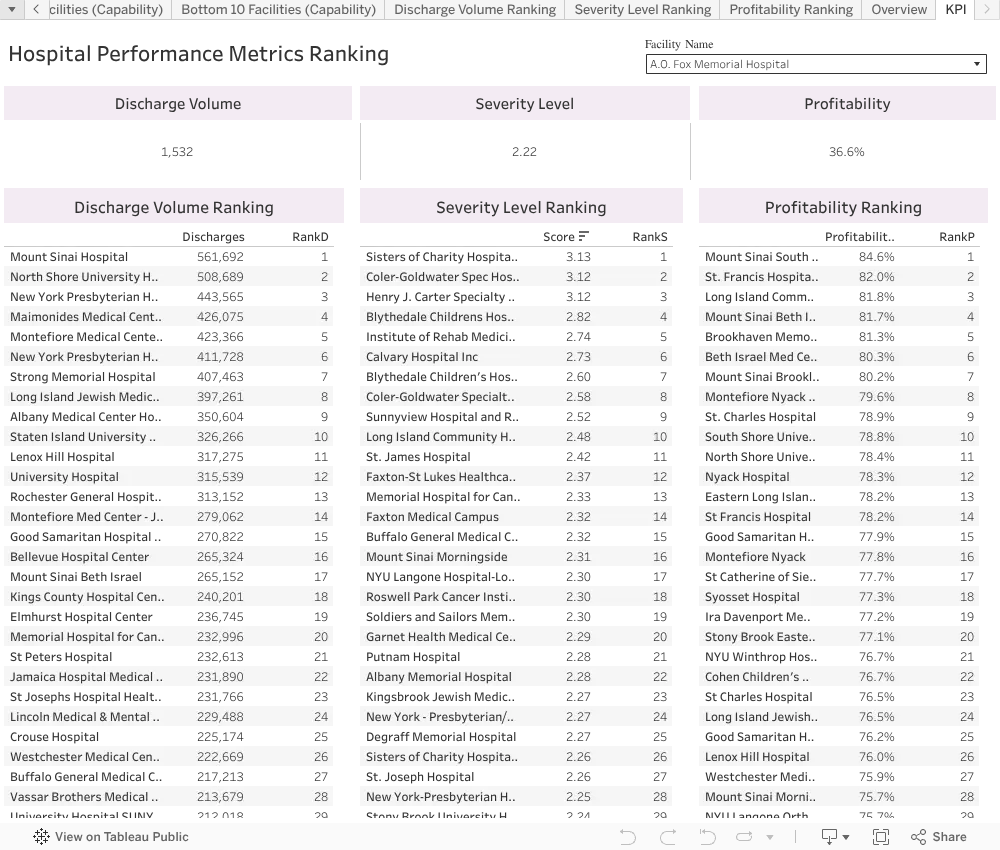
Hospital Performance Metric Ranking Dashboard
If the dashboard is loading too long, feel free to open in here